Case study
Orthogonal analysis of individual human residual proteins
We took action when our A549 ELISA went from measuring 100 to 10 ng/mL HCP in our adenovirus-based product.
When the A549 ELISA supplier launched a new version, our client saw a sudden drop in the total host cell protein (HCP) level. From one day to the next, it went from 100 to 10 ng/mL in the same batch of adenovirus-based immunotherapy. So they came to us for analyzing the HCPs with quantitative LC-MS.
A US-based immunotherapy company analyzed HCPs from the adenovirus-expressing A549 human cell line with a generic ELISA kit. However, they had come to have concerns about the validity of the kit. It thus prompted them to look for orthogonal data for their IND documentation.
We started by comparing the HCP profiles of their three batches using LC-MS to investigate the qualitative and quantitative differences.
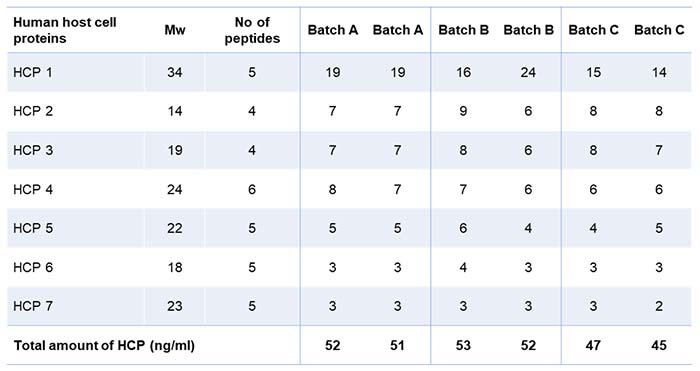
Table 1 shows the result of the residual HCP analysis using mass spectrometry. The client was satisfied to see that the samples were relatively clean, as only seven human proteins were identified and quantified. The total amount of HCP is summarized at the bottom of the table. The data thus indicates that the batches were consistent, with somewhat fewer HCPs in batch C.

Table 1: Anonymized list of Host Cell Protein in duplicate samples from three batches
Bonus: Easy measurement of the viral proteins
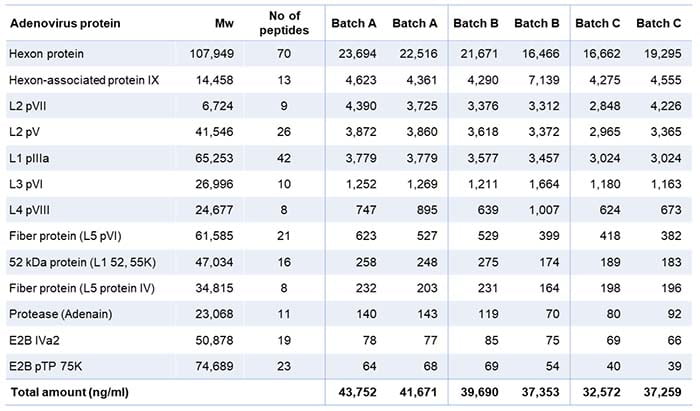
In addition, the analysis gave a valuable overview of the individual quantities of adenovirus proteins present (Table 2). The table shows two analytical values for each batch because we ran the LC-MS analysis with and without standard proteins to check for their influence.

Table 2: List of viral proteins present in the three batches tested
The analysis identified 14 viral proteins from the adenovirus. Batch C contained a somewhat lower total amount of viral proteins, which may explain why the HCP amount was lower in this batch.
The other method that the client was using was a classical 1D SDS PAGE. This method involves running the samples on a polyacrylamide gel, doing silver staining, and cutting out the bands of interest, followed by LC-MS analysis.
Compared to this old method, the LC-MS technique offers several advantages: Using SDS PAGE is tiresome and time-consuming, with multiple, manual steps which may introduce errors, whereas LC-MS is fast and automated. Also, the 1D SDS PAGE only provides the identity of the viral proteins by comparing to a known standard, and not the quantities, which you get with LC-MS. Moreover, SDS PAGE does not show the lower-abundant HCPs and viral proteins, whereas LC-MS gives you the complete protein picture.
Find out more about the gene therapy product analysis here
Talk to us
Whatever protein-related challenge or question you may have, we would love to help. Our experts can help you decide on the best analytical approach for your project by email or online meeting - providing advice without obligation.